
Josh Myers
November 17, 2017
AWS logging pipeline
The problem space
Back in the day, a logging pipeline was a pretty manual thing to setup and manage. Yes, configuration management tools like Chef/Puppet made this somewhat easier, but you still had to run your own ELK stack (OK, it didn’t have to be ELK, but it probably was, right?) and somehow get logs in there in a robust way. You’d probably be using some kind of buffer for the logs between source and your ELK stack. Eugh. I remember the first implementation of this I did roughly followed this blog post from Lusis. Since then I’ve seen this implemented a bunch of ways, some more up to date than the above. Let’s be honest; no one wants to run and maintain their own ELK stack. It is a pain to maintain and likely doesn’t add value to your core product.
Overview
This blog post will focus on building a robust logging pipeline by using Terraform to leverage AWS services. The logging pipleine will ingest data and output it into a searchable log aggregation tool like ElasticSearch and Kibana (a web interface for searching logs). It does this using a repeatable and testable infrastructure as code methodology.
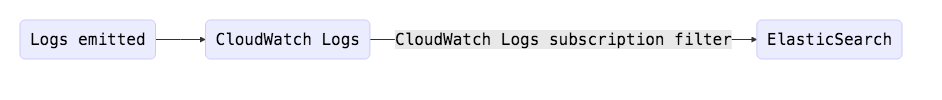
I won’t go into why centralised logging is super important in any deployment, that should be par for the course these days. In this example, the logs end up in an AWS Elastic Search cluster, but this could be easily tweaked to send to any logging SaaS provider e.g. SumoLogic, Logit. The logging pipeline uses KMS to encrypt data at rest for all the service components and gives operators various ways to view the log data. See cover image for what the pipeline looks like.
Logs are emitted into a CloudWatch Logs Group. A Kinesis stream is created to subscribe the CloudWatch Logs Group to using a PR I submitted to the Terraform project for the cloudwatch_logs_subscription_filter. An event source mapping is then created between the Kinesis stream and a Lambda function which pulls events off the stream and POSTs to our ElasticSearch cluster.
In my previous role I implemented a similar logging pipeline which shipped logs to an external logging provider. I’ve seen this logging pipeline ship >20M messages an hour without breaking a sweat. It is also easy to tweak the Lambda function to archive the file to S3. Logs files are kept in multiple places, making it harder to shoot yourself in the foot by accidentally deleting logs, and able to backfill if you need to. All the AWS services used in this logging pipeline are PCI compliant and are using KMS for encryption at rest.
This post does not cover log shippers like CloudWatch Logs agent, Fluentd etc. Some AWS services, like CloudTrail, allow for writing logs directly to a CloudWatch Logs Group.
Short history of Terraform
Terraform is a tool to write, plan and create infrastructure as code. It uses HCL for configuration and is my preferred tool for automating cloud infrastructure deployments. I’ve been using Terraform since the early 0.4 release (read: Wild West days).
It has come on loads since then and often receives new features for provider services, like AWS, before the official provider tooling. It isn’t without problems but having a great and active community, issues get addressed pretty quickly. Since the introduction of modules, sharing Terraform code has been possible. While Terraform HCL may not lend itself completely to being shareable, community modules certainly help share workable patterns for structuring Terraform code. If you aren’t having to reinvent the wheel for every project you work on, this massively speeds up the delivery time and helps you to stay focused on working on things that add business value. My general rule of thumb - the less code you have write/maintain, the better. The Terraform Registry has just been launched to aid sharing of code and I’m hoping to get this logging module in there!
Talk is cheap - show me the code
All the code for this blog post can be found @ https://github.com/joshmyers/aws-logging-pipeline
Requirements
- AWS account with a user and permissions etc already setup.
- Terraform - This tutorial was done using Terraform 0.10.8
- NodeJS (if you want to run/test the Lambda function locally)
Running the thing
Fetch source code
$ git clone git@github.com/joshmyers/aws-logging-pipeline.git
$ cd aws-logging-pipeline
Initialize Terraform
$ terraform init
Terraform plan
$ terraform plan
Terraform refreshes state of each resource and wants to create a load of resources for us. If all has gone well the plan should end with something like:
Plan: 25 to add, 0 to change, 0 to destroy.
Terraform apply
Now apply the changes to create our infrastructure:
$ terraform apply
Testing the thing!
Note the example stream names are foo, bar, baz. We first need to create a log stream (this would normally be done by the log emitter) so that we can put some example logs into it:
aws logs create-log-stream --log-stream-name test_log_stream --log-group-name foo
Let’s put some sample log data into our CloudWatch Logs stream. After each put event, CloudWatch Logs returns a sequence token which needs to be used on the next put request:
$ aws logs put-log-events --log-group-name foo --log-stream-name test_log_stream --log-events "[{\"timestamp\":$(date +%s%3N), \"message\": \"ilikecats\"}]"
{
    "nextSequenceToken": "49576145819449297225068466549307447566054980555305397474"
}

$ aws logs put-log-events --log-group-name foo --log-stream-name test_log_stream --log-events "[{\"timestamp\":$(date +%s%3N), \"message\": \"im an awesome log file\"}]" --sequence-token 49576145819449297225068466549307447566054980555305397474
{
    "nextSequenceToken": "49576145819449297225068466613143566544985862107830430946"
}


$ aws logs put-log-events --log-group-name foo --log-stream-name test_log_stream --log-events "[{\"timestamp\":$(date +%s%3N), \"message\": \"search me im a log\"}]" --sequence-token 49576145819449297225068466613143566544985862107830430946
{
    "nextSequenceToken": "49576145819449297225068466654540813386049610655280934114"
}
awslogs is an awesome tool to make it easier for humans to consume CloudWatch Logs, without having to leave the command line. Let’s see if our logs made it into our CloudWatch Log Groups:
$ awslogs get foo --start="10mins ago"
foo test_log_stream ilikecats
foo test_log_stream im an awesome log file
foo test_log_stream search me im a log
Yup! Super, we know we managed to get some logs into the first stage of the pipeline. Have they made it through into our ElasticSearch cluster?
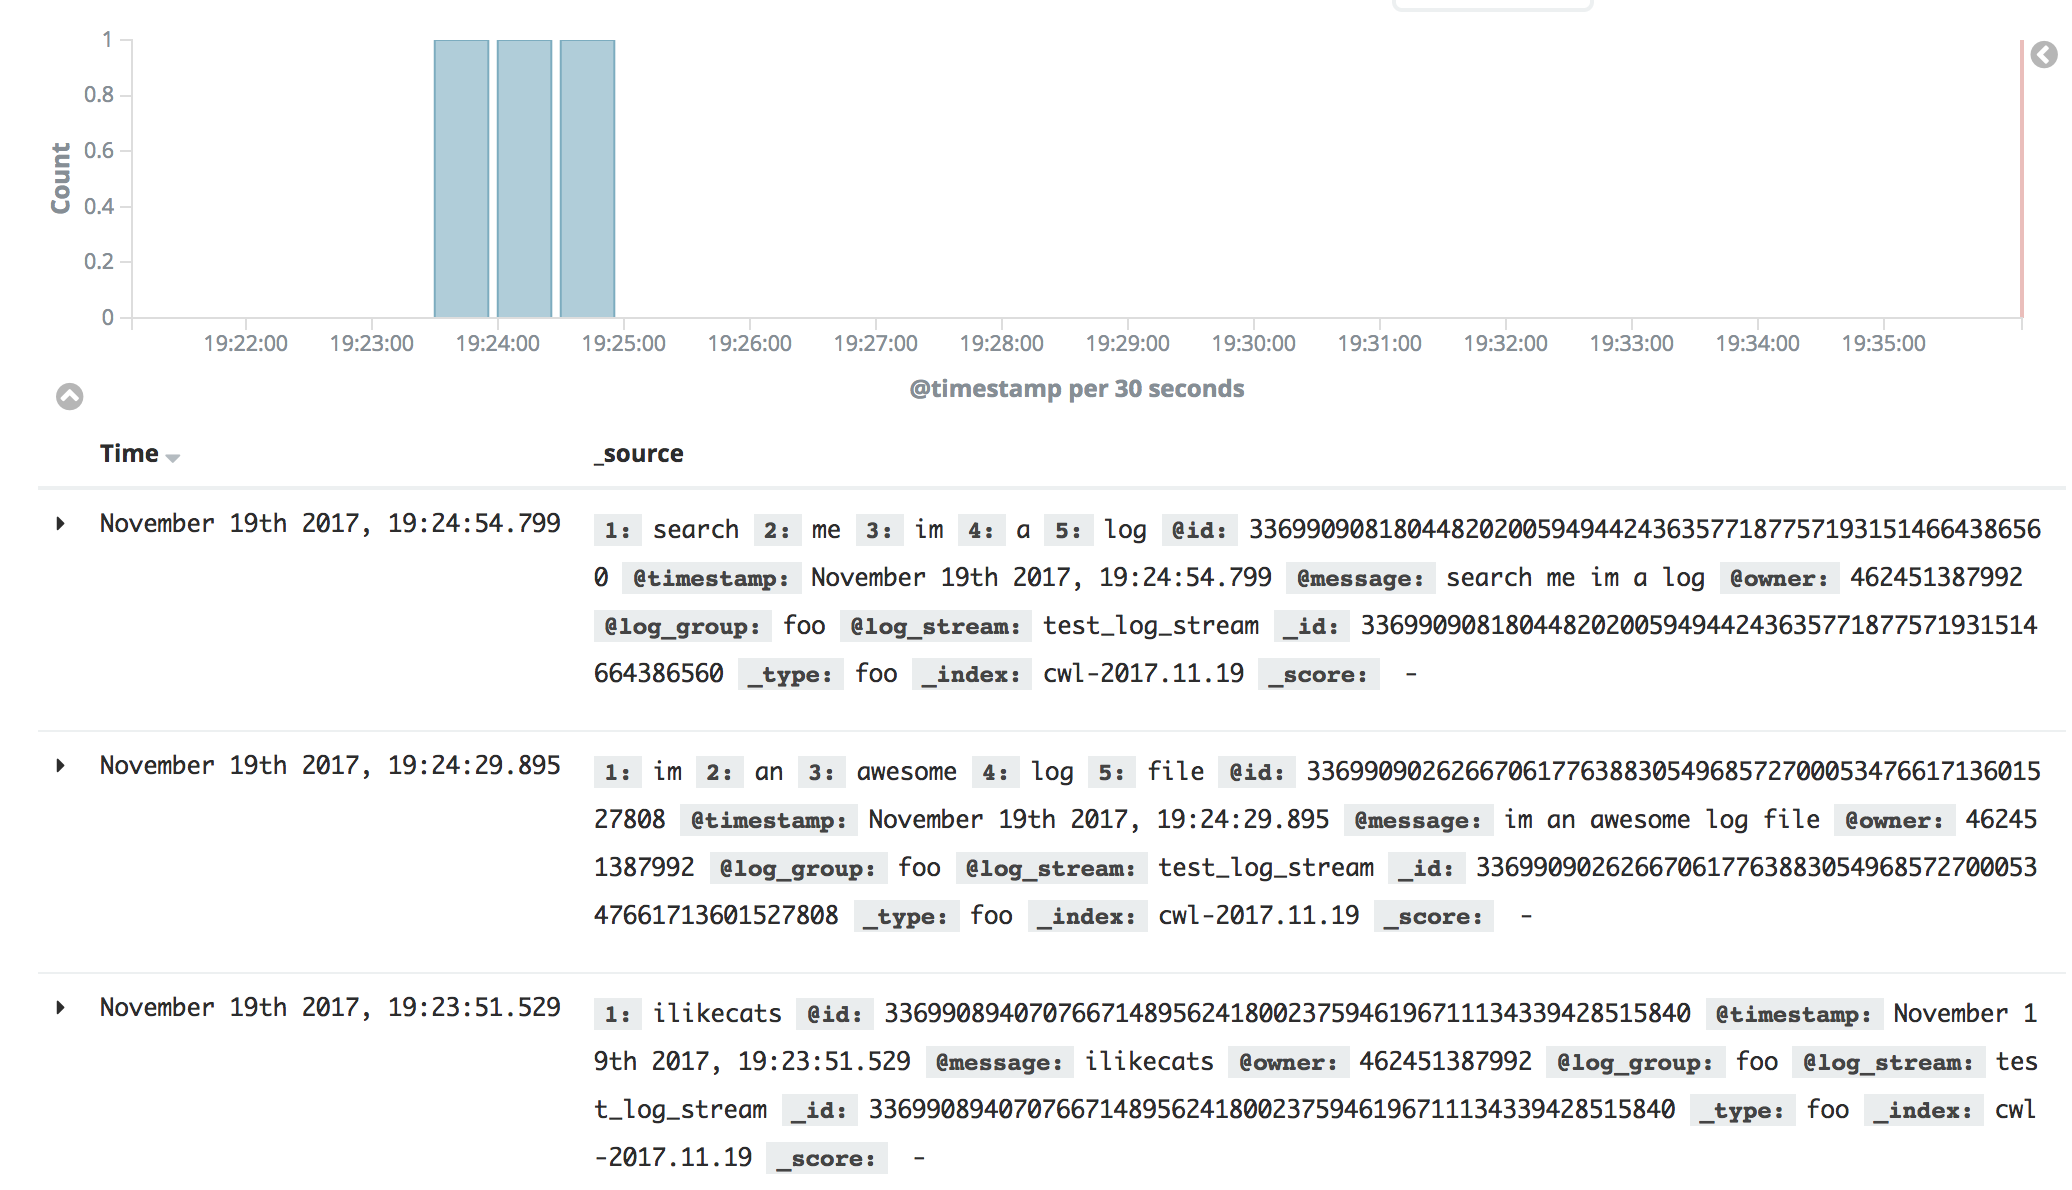
Yup! Awesome, we have some searchable logs in a centralised logging setup. What actually happened here?
- The log events were put onto a CloudWatch Logs Stream. A CloudWatch Logs Group may contain a number of streams. Say, maybe, a stream for every host? You get the idea.
- CloudWatch Logs subscribes to a Kinesis stream and puts the log events into a connected stream. Kinesis buffers our logs in a “shard”.
- The Lambda function takes events off the Kinesis stream, up to
${var.lambda_event_mapping_batch_size}at a time and then:- Iterates through the log events
- Unzips and base64 decodes them
- Adds them to a list
- Constructs our ElasticSearch payload
- Signs our request to the ElasticSearch cluster with a V4 signature
- POST to our ElasticSearch
/_bulkendpoint.
Gotchas
Why not stream directly to ElasticSearch from CloudWatch Logs?
A CloudWatch Log Group can subscribe directly to ElasticSearch, so why bother with Kinesis and Lambda? Flexibility and ElasticSearch lock-in. With the above setup, it would be super easy to tweak the Lambda function to POST to another Logging SaaS provider and maybe do something else too, like archive the log to S3?
Why have Kinesis in the middle when CloudWatch Logs can stream directly to Lambda?

Lambda will try to execute up to 3 times when triggered by an event. After that, it drops the event on the floor. If it can’t successfully send the event, say because cough an expired TLS certificate at your logging provider cough, wave that event goodbye.
Why not use Kinesis firehose and write all logs to S3 and point my logging provider at the S3 bucket to hoover up my logs?
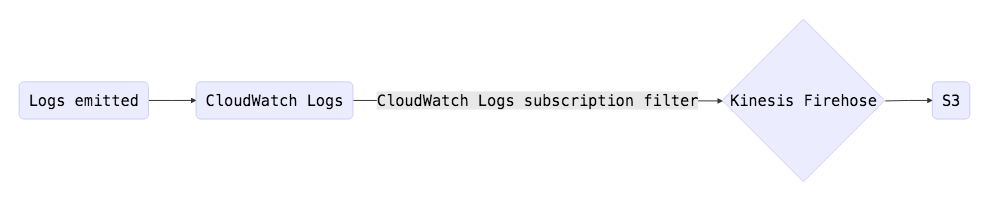
This was something we did at first. It worked, but after not too long, we noticed lag between logs entering the pipeline and being searchable in the logging provider. Logs were entering the pipline and actually ending up in S3 in a timely fashion. The problem was the prefix files were being written to S3. It is easy to forget that although S3 looks like a normal file system, it is actually a key/value store. The logging provider was trying to enumerate a large bucket full of lots of small files, and ultimately timing out. That bucket would only ever get more and more files causing lag to increase. So we changed tact to the above solution but also had the Lambda function write the files to S3 after posting to SaaS provider.
Kinesis limits
Kinesis has some interesting limits e.g. “UpdateShardCount provides up to 3 calls per rolling 24-hour period per region”. While I haven’t been bitten by these limits, it is worth noting and making sure it fits your workload.
Summary
Hopefully this post has been useful and demonstrates a production ready logging pipeline. Look out for it in the Terraform registry! Interested on any feedback and happy to answer any further questions.
comments powered by Disqus